


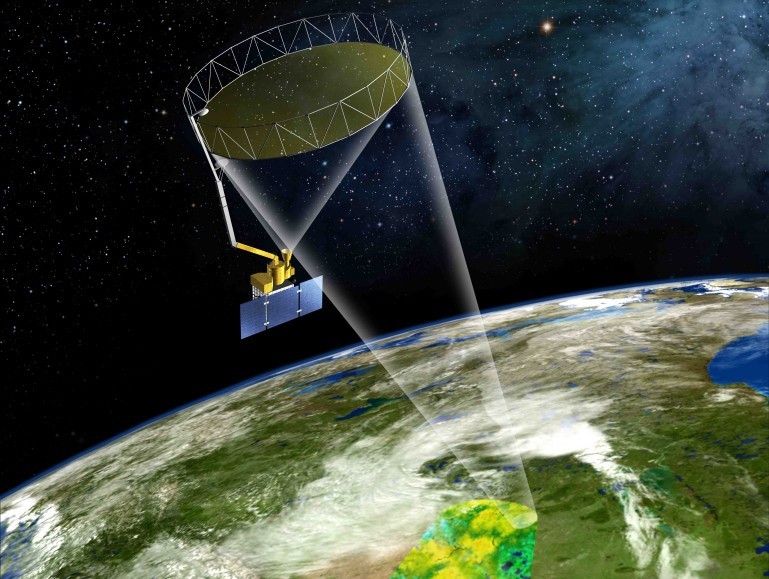
Crop insurance has always struggled with the distance between what’s reported and what’s real. Earth observation satellites are resolving that separation, turning claims into data events. With hundreds of new imaging and radar missions launched in just three years, insurers can now verify crop damage, model yield risk, and issue payouts with precision that was once impossible.
Between 2022 and 2025, 405 EO satellites entered orbit across imaging, radar, meteorology, and climatology missions, tripling global monitoring capacity. What began as a scientific tool for environmental observation has become an invaluable layer of the world’s financial risk infrastructure.
How Do 405 Satellites Create a New Era of Global Visibility?
Between 2022 and mid-2025, 405 Earth observation satellites entered orbit, one of the fastest infrastructure expansions in the history of the space economy. What was once a limited constellation of government-operated eyes on Earth has become a dense, commercially driven mesh of sensors capable of capturing near-continuous global imagery.
The largest category, high-resolution imaging satellites (<5 m), now accounts for 228 spacecraft, or 56 percent of active EO capacity. These platforms include optical, radar, and hybrid instruments optimized for sub-5 meter detail, enabling continuous observation of crop growth, soil conditions, and seasonal variability across millions of square kilometers. This level of coverage allows insurers, agribusinesses, and environmental agencies to monitor change in near-real time rather than rely on sparse ground data.
Radar satellites form the second largest segment, with 75 missions (19%) providing day-night, all-weather imaging — an essential capability for regions prone to heavy cloud cover, flooding, or monsoon conditions. Meanwhile, meteorological and climatology spacecraft add another 50 missions (12%), feeding continuous atmospheric and temperature data into risk and yield models that underpin parametric insurance products. The remaining 52 satellites (13%) support oceanographic, atmospheric, and situational awareness roles, rounding out the environmental intelligence layer that connects climate, water, and land systems.
Mission Breakdown:
| Mission Segment | Active Satellites | Share of Total |
|---|---|---|
| EO / Imaging (<5 m) | 228 | 56% |
| Radar (SAR) | 75 | 19% |
| Meteorology + Climatology | 50 | 12% |
| Other | 52 | 13% |
| Total | 405 | 100% |
Why Has Earth Observation Capacity Grown Tenfold Since 2022?
EO capacity is growing at a breakneck pace. From a base of just 15 satellites in 2022, annual launches surged to 66 in 2023, 157 in 2024, and 167 year-to-date in 2025 — a tenfold increase in annual deployment. The compound annual growth rate of roughly 142% places EO among the fastest-scaling segments of the entire space economy.
Launch Growth:
| Year | New Satellites | Growth vs Prior Year |
|---|---|---|
| 2022 | 15 | – |
| 2023 | 66 | +340% |
| 2024 | 157 | +138% |
| 2025 (YTD) | 167 | +6% |
This acceleration shows a shift toward operational redundancy and temporal density. Higher launch frequency allows constellations to maintain sub-daily global coverage, improve resilience against single-point failures, and provide near-real-time analytics for sectors like agriculture and insurance that depend on continuity as much as resolution.
Who Now Owns the Majority of Earth Observation Satellites?
Commercial operators now dominate orbital observation. Of the 405 active satellites with known sector attribution, 306 (roughly 78%) are commercially owned, a decisive shift from when civil space agencies such as NASA, ESA, and JAXA set the pace for Earth observation capacity. Government and civil missions account for 17%, while dedicated military and intelligence assets represent just 5% of the total.
Sector Distribution:
| Sector | Active Satellites | % Share |
|---|---|---|
| Commercial | 306 | 78% |
| Government / Civil | 66 | 17% |
| Military / Intelligence | 21 | 5% |
Planet Labs, which operates 115 active satellites, is the world’s largest optical imaging constellation. Its Dove and SuperDove fleets deliver 3–5 meter resolution imagery with near-daily global revisit, forming the backbone of many commercial monitoring platforms used across agriculture, forestry, and insurance. Other leading contributors include Orbital Effects (22 satellites), Satellogic (21), Spire (17), ICEYE (11, SAR specialist), and GHGSat (11, greenhouse gas monitoring).
How Do Optical and SAR Satellites Work Together in Crop Insurance?
No single imaging technology can capture the full complexity of agricultural risk. Optical and radar satellites each observe different layers of the same landscape — one spectral, the other structural — and together they form the analytical framework of modern crop insurance.
Technology Comparison:
| Feature | Optical Imaging | Radar / SAR Imaging |
|---|---|---|
| Spectral Data | Multispectral bands enable NDVI, EVI, and vegetation indices | Provides structural and moisture insights through backscatter |
| Weather/Lighting | Limited by cloud cover and daylight | Works day/night and through clouds |
| Resolution | Typically 3–5 m, sub-meter possible | 1–3 m achievable in spotlight modes |
| Best Use Cases | Crop health monitoring, yield modeling | Flood mapping, soil moisture, storm damage |
Optical sensors collect multispectral data across visible, near-infrared, and red-edge bands, producing vegetation indices such as NDVI and EVI that quantify crop health and biomass. Synthetic Aperture Radar (SAR), by contrast, measures surface structure and moisture through backscatter and coherence analysis. SAR imagery works in all conditions, including day or night, clear or stormy, with 1–3 meter resolution achievable from providers like ICEYE and Capella.
When fused, optical and radar data produce a resilient, always-on monitoring system capable of both assessing gradual crop performance and verifying sudden loss events. Insurers now use these combined data streams to:
- Monitor and verify crop health throughout the season, reducing the need for field inspections
- Assess damage rapidly, mapping floods or hail impact within hours of occurrence
- Mitigate fraud, validating claims against objective satellite evidence
- Trigger parametric payouts, linking compensation directly to rainfall, soil moisture, or biomass thresholds
What Strategic Advantages Does EO Provide to Crop Insurers?
Earth observation is redefining how agricultural risk is quantified, moving crop insurance from reactive claims handling to proactive, data-led portfolio management. Competitive advantage will increasingly depend on four capabilities:
- Securing multi-modal coverage (optical + SAR + meteorological) to maintain visibility under all conditions
- Integrating EO analytics directly into pricing and portfolio models, allowing real-time adjustments to exposure and premium structures
- Forming strategic partnerships with leading constellation operators to ensure priority tasking and low-latency delivery
- Expanding parametric offerings into regions where traditional ground-based verification remains limited
Conclusion
Earth observation is no longer a supporting technology; it is becoming part of the financial infrastructure of agriculture. As insurers, agritech firms, and governments align around shared data standards and faster delivery cycles, the distinction between monitoring the planet and managing its risks is starting to blur. The next opportunity will not be more images from orbit, but the intelligence systems that turn them into financial certainty on the ground.
@ImageCredits: Nasa


